Break-Even Analysis Workbook (Excel) — Know Exactly When Your Business Turns Profitable
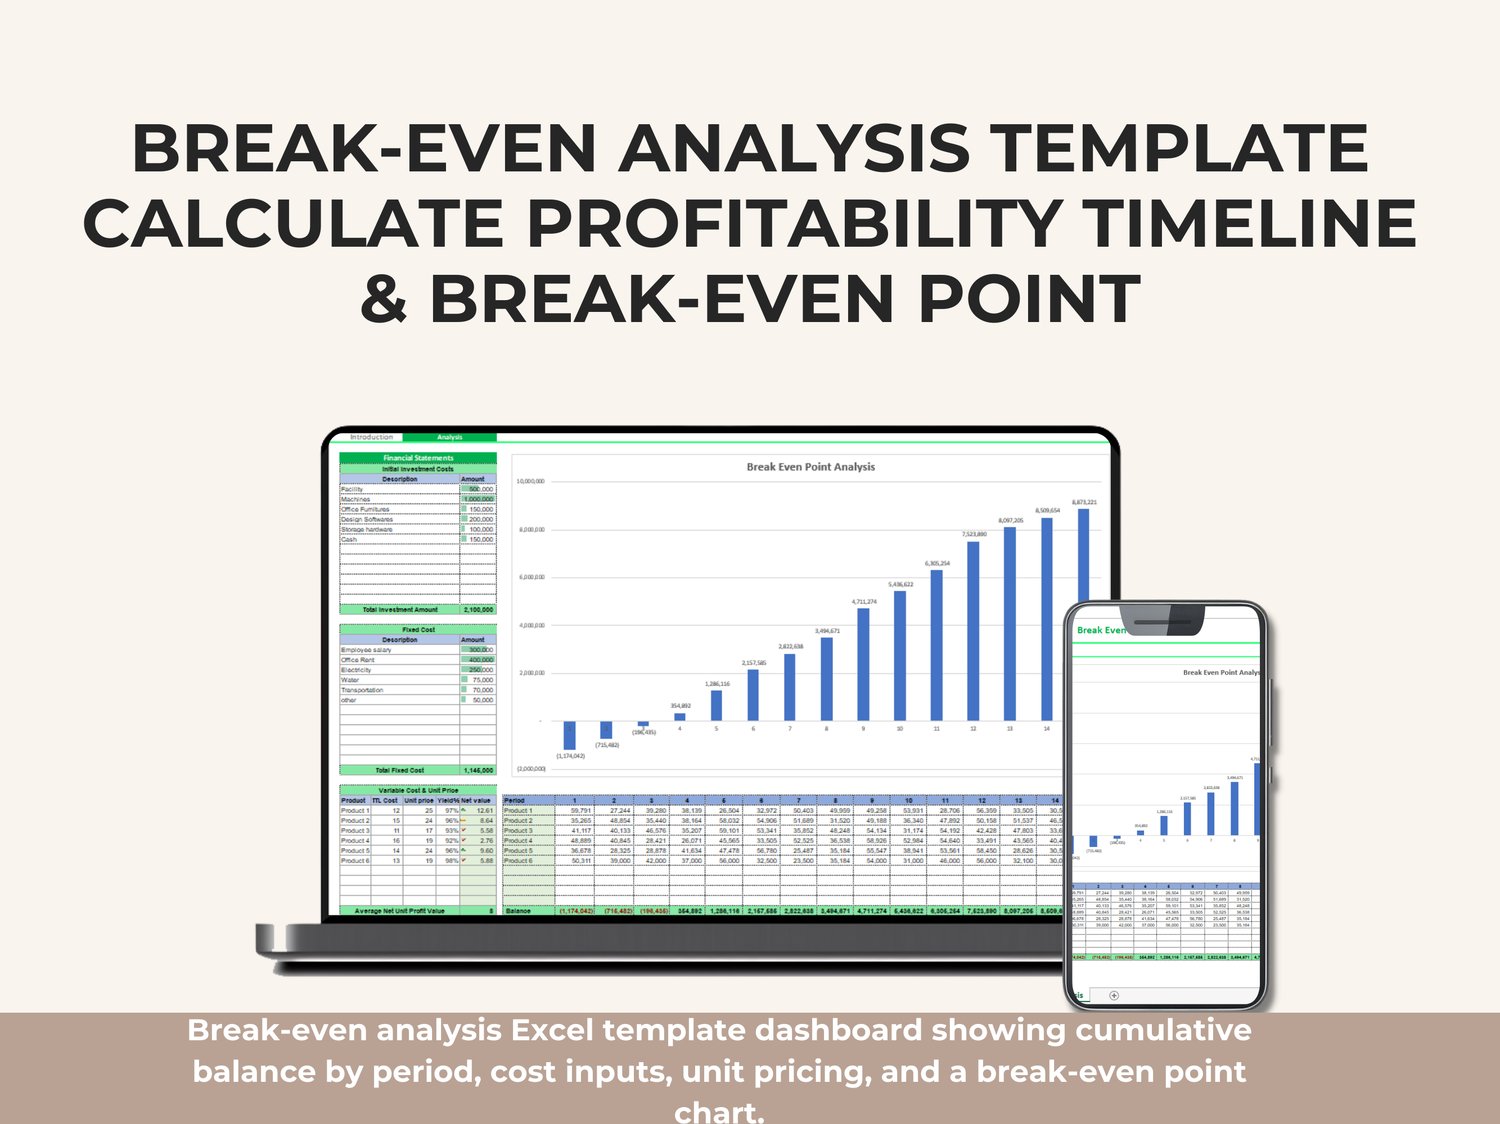
If your real question is: “When will this business stop costing money and start paying back?” this Break-Even Analysis workbook gives you the answer—clearly, quickly, and with a visual that makes it easy to explain to partners, investors, or management.
Break-even analysis is a core financial method used to identify the point where total revenue equals total costs. At that moment, the business is no longer operating at a loss—but it isn’t generating profit yet either. Once you pass the break-even point, every additional period of sales typically contributes to profit (after covering fixed costs).
This ready-to-use Excel template helps you calculate and present the break-even point by combining:
✅ Initial investment costs (startup / launch costs)
✅ Fixed costs (costs that remain stable each period)
✅ Variable costs + unit pricing (per product/service economics)
✅ Forecasted sales quantities across periods
✅ Automatic net profit, cumulative balance, and a break-even chart
What this template helps you do
✅ Calculate the break-even point based on your actual inputs
✅ Estimate when cash losses end and recovery begins (period-by-period)
✅ Model multiple products/services at once (up to 6 products)
✅ See the cumulative balance trend and identify the first profitable period
✅ Present results visually using an automatically updated break-even chart
✅ Support business plans & feasibility studies with clean, structured outputs
What’s inside the workbook
The workbook is organized into clear sections (with an easy layout):
✅ Initial Investment Costs
Add everything required to start the business or project (facility setup, equipment, software, licensing, setup fees, etc.). The sheet totals your investment automatically.
✅ Fixed Cost List
Enter recurring expenses that do not change with production or sales volume (salaries, rent, utilities, admin expenses, and more). The workbook calculates the total fixed cost per period.
✅ Variable Cost & Unit Price (Per Product)
For each product/service, you enter:
✅ Total unit cost (variable cost)
✅ Unit selling price
✅ Yield % (optional efficiency/realistic yield factor)
The sheet calculates the net unit profit value automatically.
✅ Forecast Quantity Table (By Period)
Forecast your expected quantity sold/produced for each product across 15 periods (you decide what a “period” means: month, quarter, etc.). This drives the financial forecast.
✅ Automatic Calculations & Final Outputs
The workbook calculates:
✅ Net profit per product per period
✅ Total net profit per period
✅ Fixed cost impact per period
✅ Initial investment deduction
✅ Cumulative balance (running total) to reveal the break-even point
✅ Break-Even Point Chart (Visual)
A clean chart displays the cumulative balance across periods so you can instantly see:
✅ When the business is still negative (loss zone)
✅ Where the line crosses into positive territory (break-even)
✅ How profitability grows after break-even
How to use it (simple workflow)
➡️ Step 1: Enter your Initial Investment Costs
➡️ Step 2: Enter your Fixed Costs (for your chosen period type)
➡️ Step 3: Enter Variable Cost, Unit Price, and Yield % for each product
➡️ Step 4: Forecast quantities per period (1–15)
➡️ Step 5: Review the Balance row + Break-Even chart to find the first period where the balance turns positive
Who this template is for
✅ New business owners building a business plan
✅ Startups validating profitability timelines
✅ Project-based businesses estimating payback period
✅ Manufacturers and service providers comparing products
✅ Anyone preparing feasibility studies, funding decks, or internal approvals
Why break-even matters
A business that reaches break-even has proven it can cover its costs. This point is often a critical milestone in feasibility studies and investment decisions because it answers:
✅ How much do we need to sell before losses stop?
✅ How long will recovery take after launch?
✅ Which products drive profit fastest?
✅ What happens if sales volumes change?
Definitions (Quick Glossary)
✅ Initial Investment Cost
The amount required to start a business or launch a project (setup, equipment, tools, licensing, etc.).
✅ Fixed Cost
Costs that do not change as sales or production increase/decrease (rent, salaries, insurance, admin overhead).
✅ Variable Cost
Costs that change with volume (materials, packaging, commissions, per-unit labor, shipping, etc.).
✅ Unit Price
The selling price per standard unit of product/service.
✅ Yield %
An efficiency factor reflecting real output (useful when not all produced units are sellable at full value).