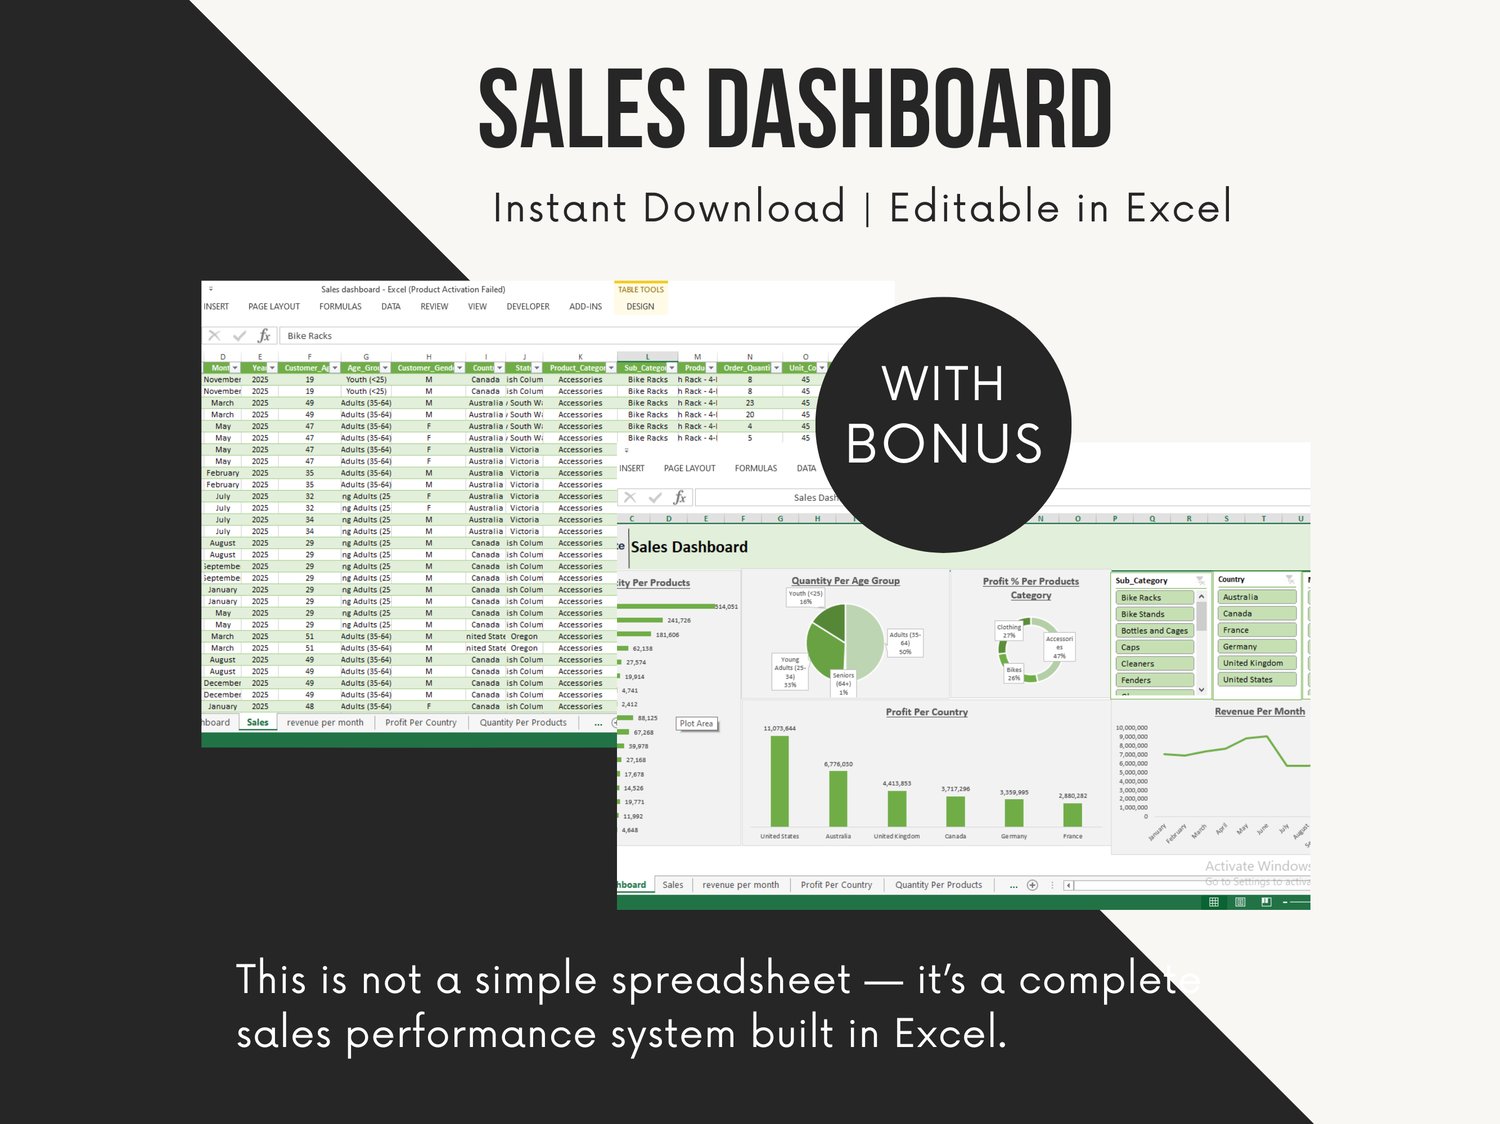
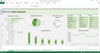
The Sales Dashboard Excel Template is a fully interactive, data-driven solution designed to help business owners, analysts, and managers monitor sales performance, profitability, and trends in one clear view.
Built with real business logic and professional dashboard design, this template transforms raw sales data into actionable insights using dynamic charts, slicers, and automated calculations — without requiring any advanced Excel skills.
What This Sales Dashboard Helps You Do
This template allows you to:
✔️ Track sales quantities and revenue across products and categories
✔️ Analyze profit performance by product, category, and country
✔️ Understand customer behavior by age group and demographics
✔️ Monitor monthly revenue trends visually
✔️ Filter and explore data instantly using interactive slicers
All insights update automatically as soon as you change or add data.
Dashboard Insights Included
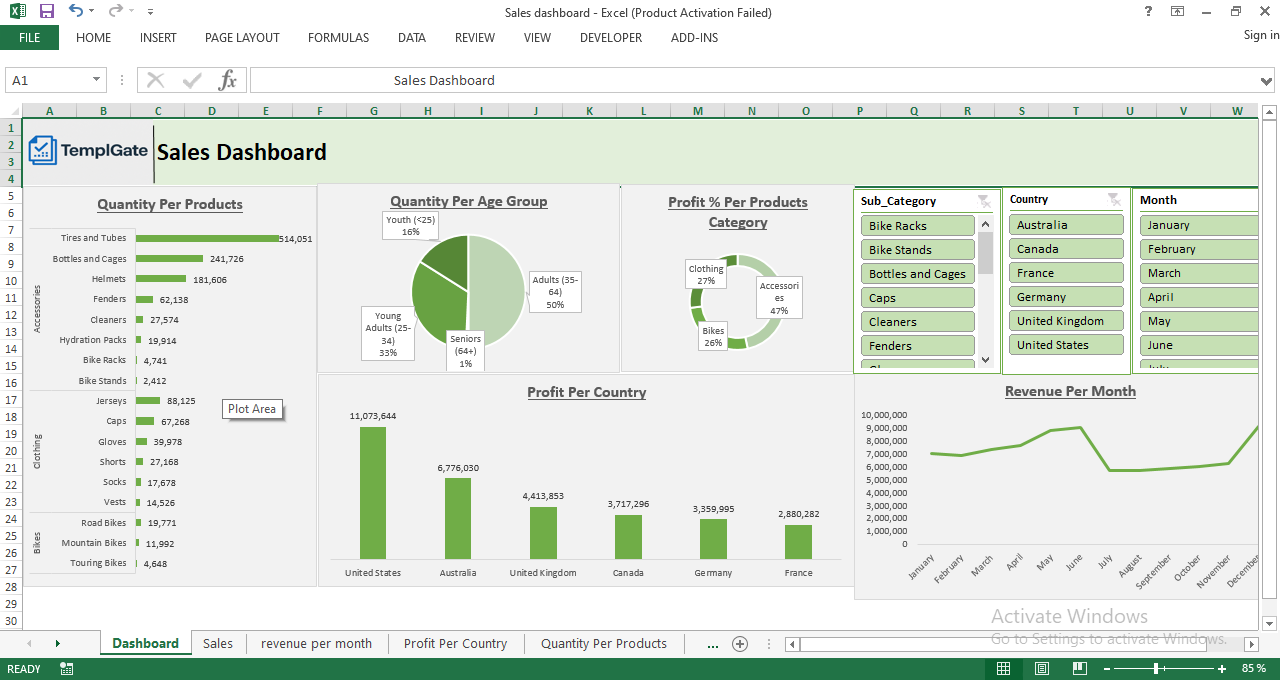
The dashboard includes multiple professionally designed visual sections:
📊 Quantity Analysis
• Quantity per product
• Quantity distribution by age group
• Clear comparison between accessories, clothing, and bikes
💰 Profit Analysis
• Profit by product category
• Profit per country (United States, Australia, Canada, Germany, France, United Kingdom)
• Visual comparison of high-performing and low-performing markets
📈 Revenue Tracking
• Revenue per month with trend line
• Easy identification of peak and low sales periods
👥 Customer Insights
• Customer age groups (Youth, Young Adults, Adults, Seniors)
• Gender distribution
• Customer segmentation linked directly to sales data
Powerful Interactive Filters (Slicers)
The dashboard includes dynamic slicers that allow you to filter all charts instantly by:
✔️ Product sub-category (Bike Racks, Bottles and Cages, Helmets, Caps, Cleaners, Fenders, etc.)
✔️ Country
✔️ Month
This makes it easy to analyze specific markets, products, or time periods in seconds.
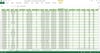
Structured & Clean Sales Data Sheet
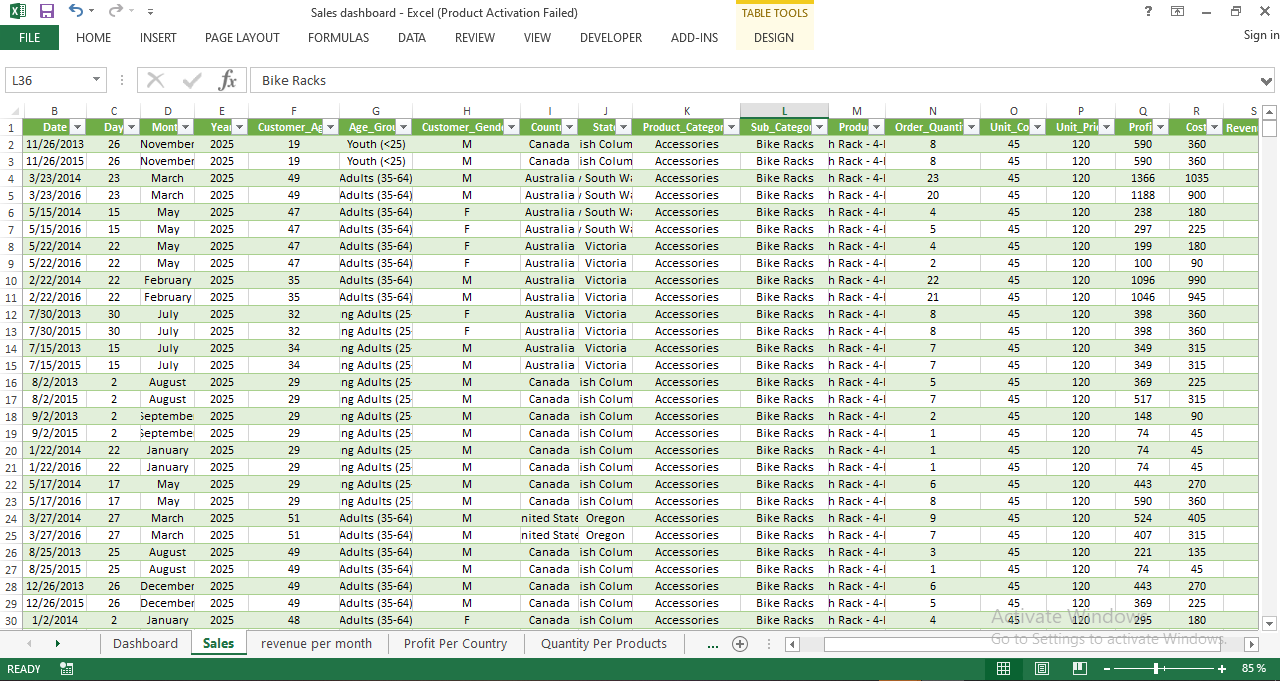
The template includes a well-organized Sales Data Table with the following fields:
• Date, Day, Month, Year
• Customer Age Group & Gender
• Country and State
• Product Category & Sub-Category
• Product name
• Order quantity
• Unit cost, unit price
• Profit, cost, and revenue calculations
All calculations are already built-in — no formulas required from the user.
Who This Template Is For
This dashboard is ideal for:
✔️ Business owners and entrepreneurs
✔️ Sales managers
✔️ Financial analysts
✔️ Data analysts
✔️ Students and professionals learning data analysis
✔️ Anyone who wants a professional Excel sales dashboard without building one from scratch
Key Benefits
✔️ Fully automated calculations
✔️ Interactive and visual design
✔️ Easy to customize with your own data
✔️ No VBA or macros required
✔️ Clean, professional layout suitable for presentations
✔️ Works with large datasets
File Format & Compatibility
• Microsoft Excel (.xlsx)
• Compatible with modern versions of Excel
• Ready to use immediately after download
Final Note
This is not a simple spreadsheet — it’s a complete sales performance system built in Excel.
Whether you’re tracking real business data or using it for analysis, reporting, or learning purposes, this dashboard gives you clarity, control, and confidence in your sales decisions.