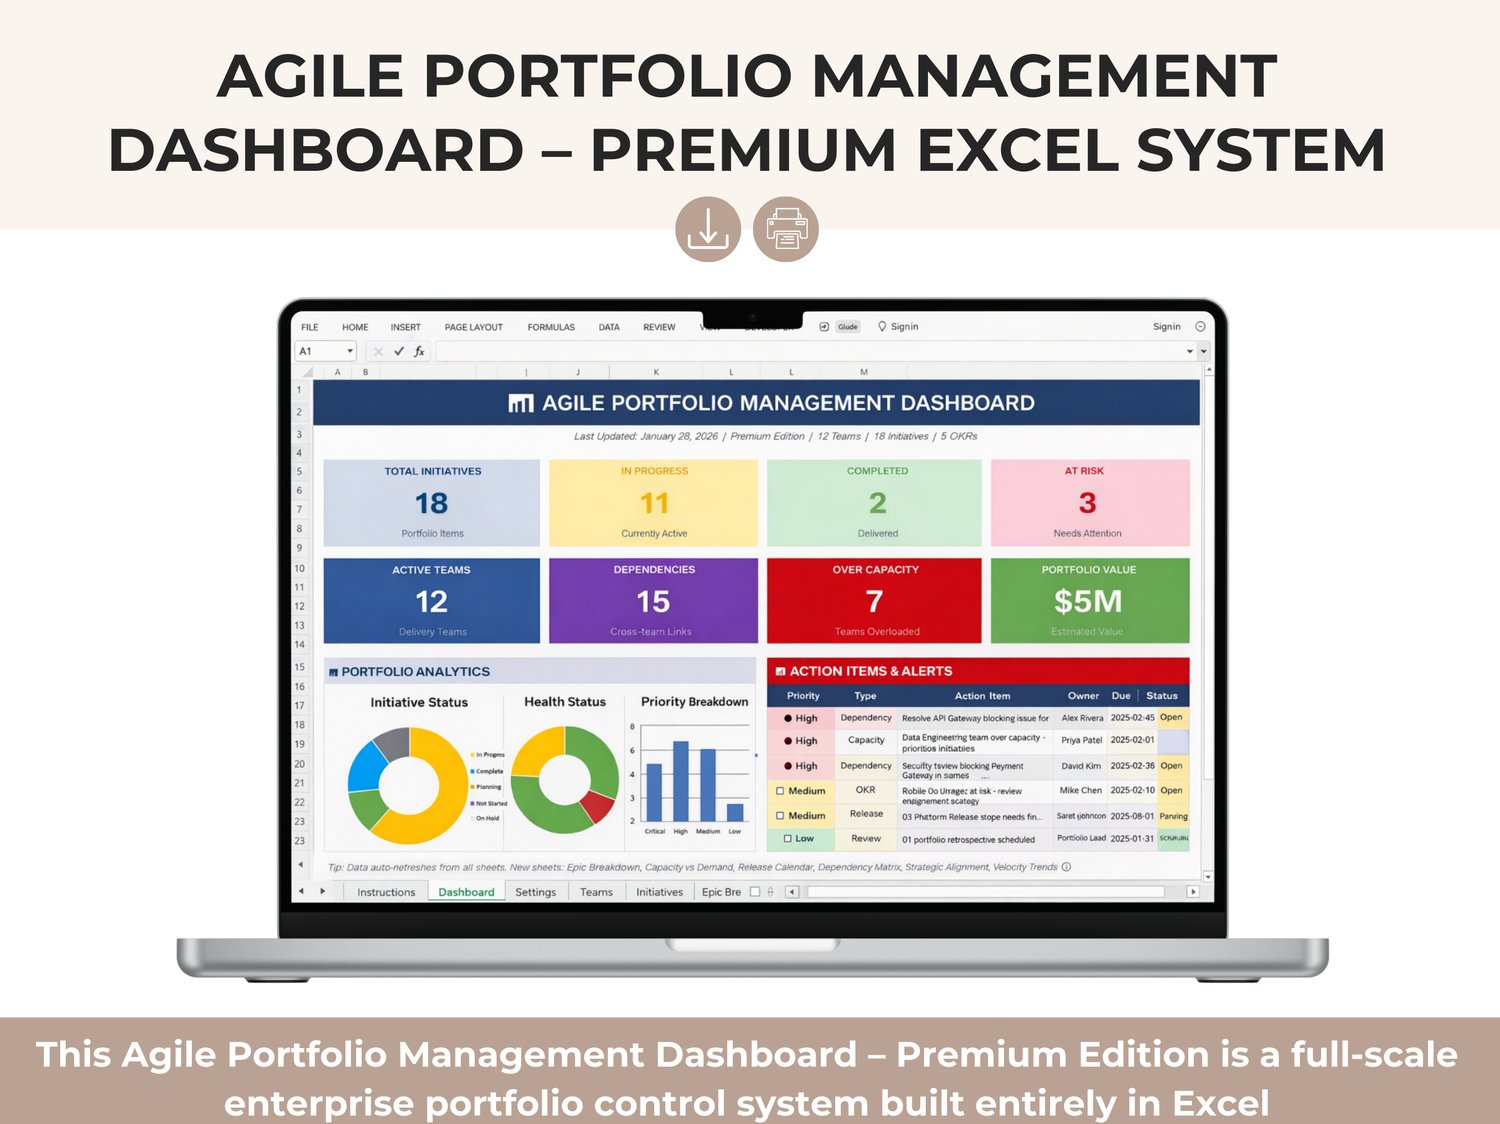
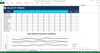
This Agile Portfolio Management Dashboard – Premium Edition is a full-scale enterprise portfolio control system built entirely in Excel, designed for PMOs, portfolio managers, agile leaders, executives, and transformation teams who need end-to-end visibility, strategic alignment, and data-driven decision-making without relying on expensive tools.
This is not a simple dashboard. It is a complete portfolio operating system that connects strategy, execution, teams, capacity, dependencies, delivery, value, and releases into one unified, automated workspace.
Every sheet is professionally structured, visually clean, and logically connected, allowing you to manage complex agile portfolios with clarity and confidence.
Executive Portfolio Dashboard (Command Center)
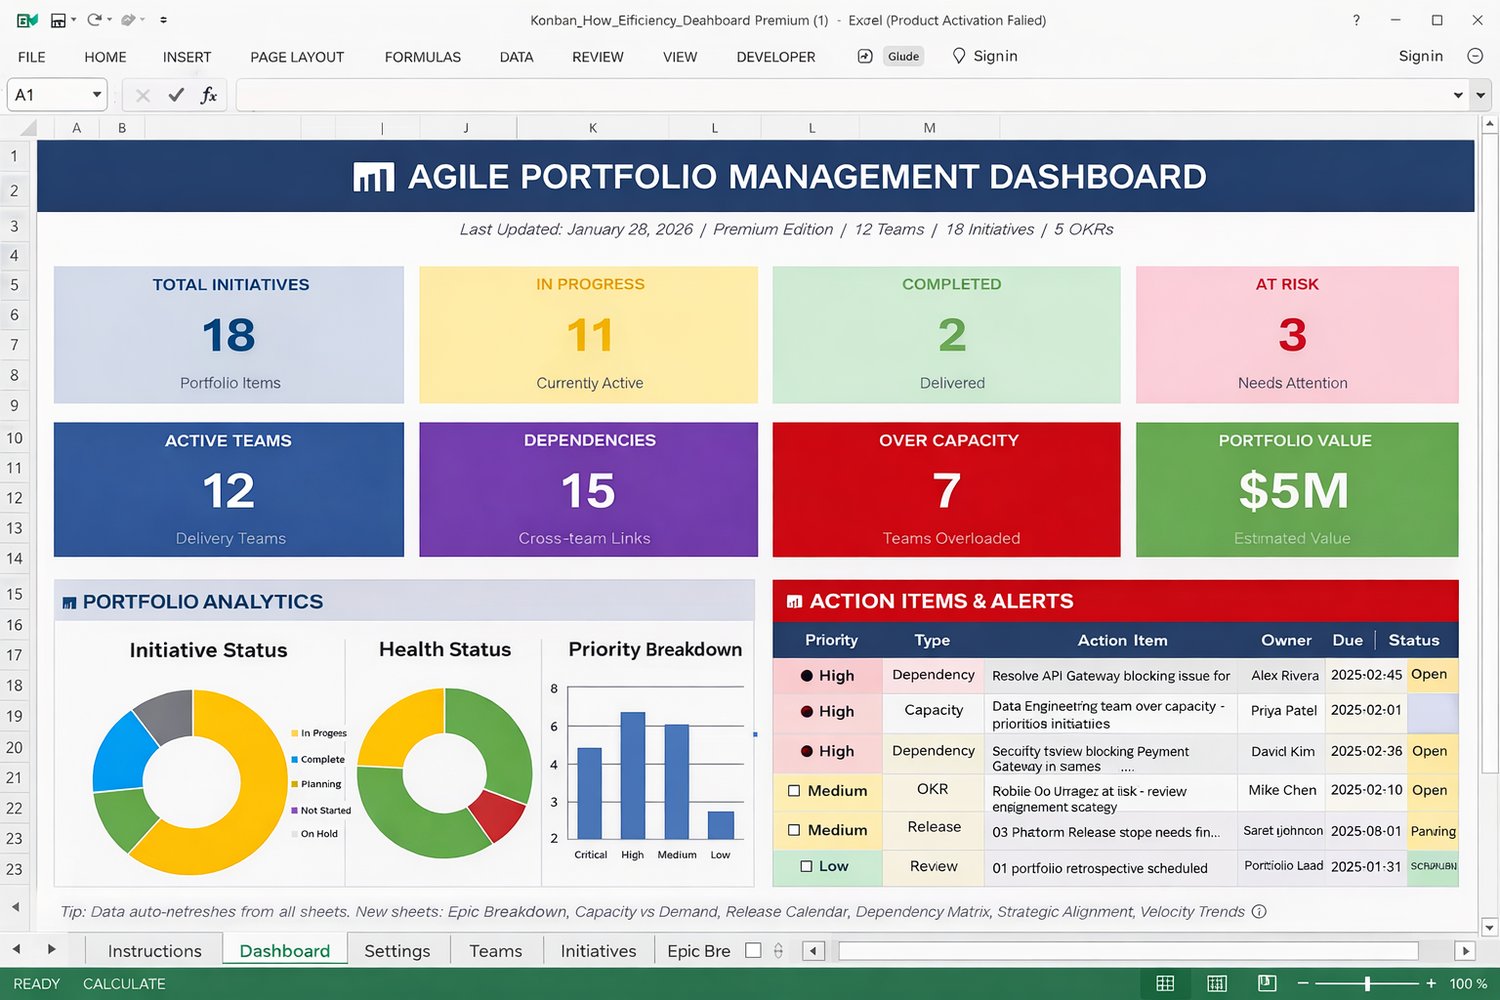
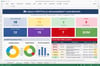
The main dashboard provides a real-time executive overview of the entire portfolio, combining delivery status, risk exposure, capacity pressure, dependencies, and value indicators in one visual command center.
You instantly see:
- Total initiatives across the portfolio
- Items in progress, completed, and at risk
- Active delivery teams
- Cross-team dependencies
- Teams operating over capacity
- Estimated portfolio value
- Priority and health distribution
- Action items and critical alerts requiring attention
This dashboard is designed for leadership reviews, steering committees, and quarterly portfolio governance, eliminating the need for manual reporting or disconnected slides.
Strategic Alignment & OKR Mapping
The Strategic Alignment sheet ensures every initiative is directly tied to business strategy and OKRs.
You can:
- Define strategic objectives and OKRs
- Break objectives into measurable key results
- Track progress for each key result
- Automatically reflect status (On Track, At Risk, Complete)
- Link initiatives directly to strategic goals
- Assign ownership and accountability
This creates true strategy-to-execution traceability, allowing leaders to clearly answer:
“Which initiatives are driving which business outcomes — and how well?”
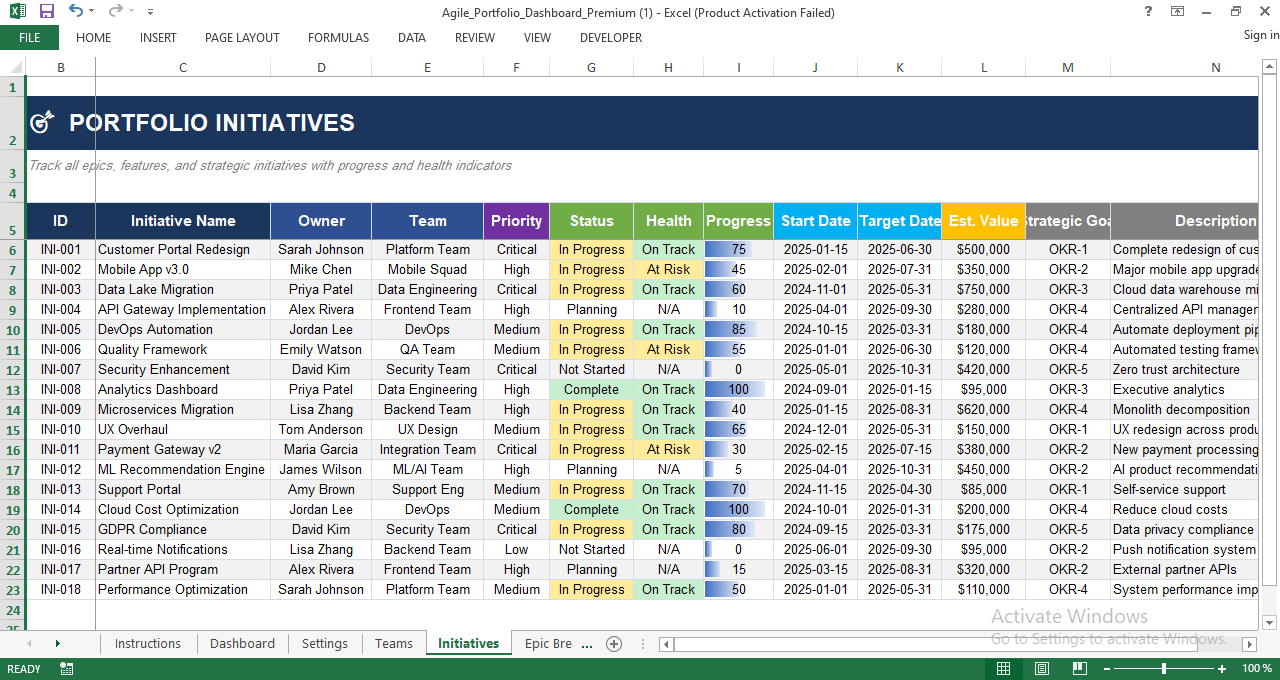
Portfolio Initiatives Management
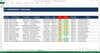
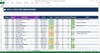
The Portfolio Initiatives sheet is the backbone of execution tracking.
Here you manage:
- All initiatives in one centralized register
- Owners, teams, priorities, and health indicators
- Progress tracking with visual bars
- Start and target dates
- Estimated financial value
- Strategic goal alignment
- Clear initiative descriptions
This sheet feeds multiple dashboards automatically and ensures consistent data across the entire portfolio.
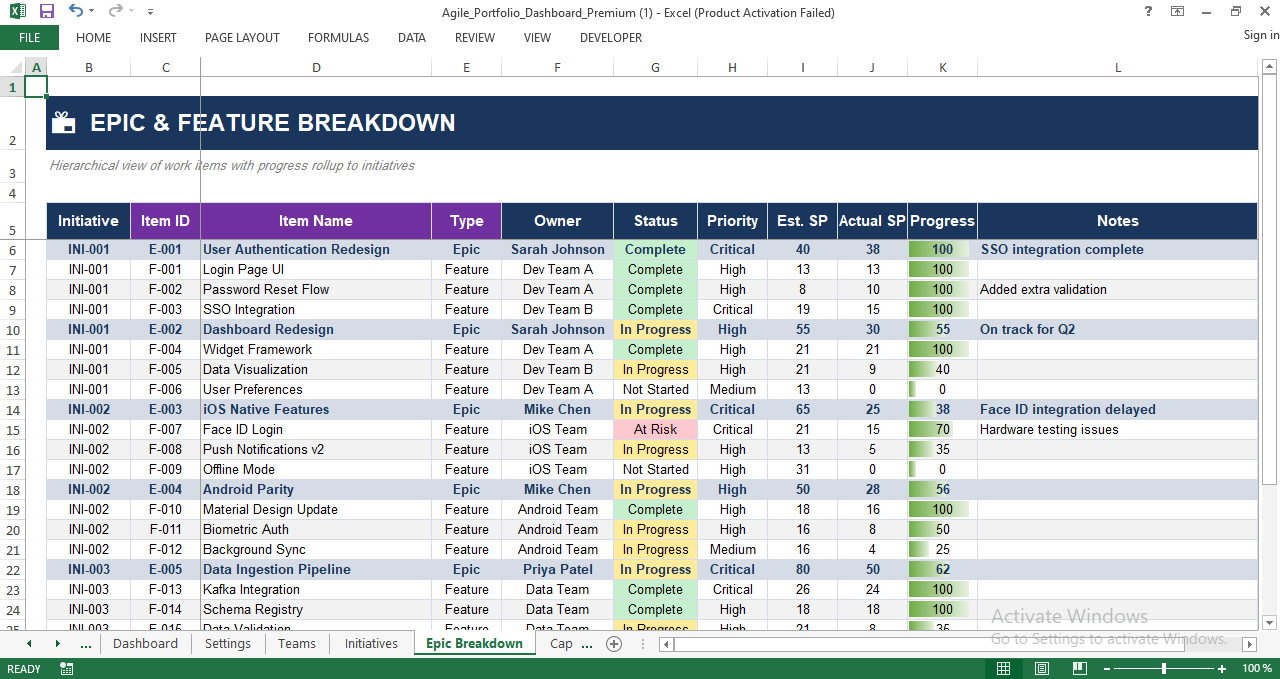
Epic & Feature Breakdown (Work Hierarchy)
The Epic & Feature Breakdown sheet provides a structured hierarchy from initiatives down to execution items.
You can:
- Break initiatives into epics and features
- Assign owners and teams
- Track estimated vs actual story points
- Monitor progress at every level
- Roll up execution status to initiatives automatically
- Capture delivery notes and blockers
This enables true agile roll-up reporting without losing execution-level detail.
Team Management & Resource Overview
The Team Management sheet gives you full visibility into team capacity, velocity, and allocation.
You can:
- Track team capacity and velocity
- Monitor allocated vs available capacity
- See how many initiatives each team supports
- Identify overloaded or underutilized teams
- Maintain clear ownership and accountability
This sheet is essential for realistic planning, demand balancing, and scaling decisions.
Capacity vs Demand Analysis
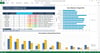
The Capacity vs Demand Analysis sheet provides a data-driven view of workload pressure across teams.
It includes:
- Capacity vs demand comparison in story points
- Variance calculations
- Utilization percentage
- Over / OK status indicators
- Gap analysis highlighting shortages or buffers
- Practical recommendations for corrective action
- Visual charts for quick interpretation
This allows portfolio leaders to anticipate delivery risks before they happen, not after deadlines are missed.
Dependency Tracking (Detailed Register)
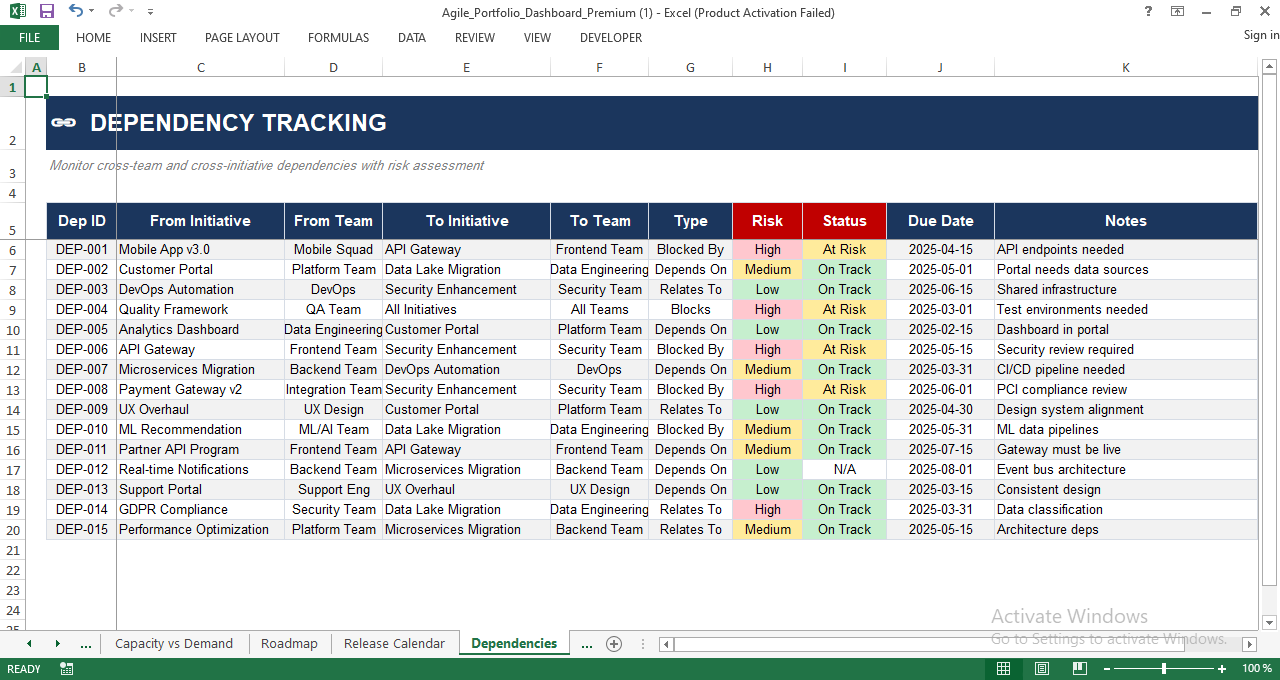
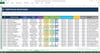
The Dependency Tracking sheet captures cross-team and cross-initiative dependencies with risk context.
You can:
- Track dependencies between initiatives and teams
- Classify dependency type (Blocked By, Depends On, Relates To)
- Assess risk level and current status
- Assign due dates and ownership
- Record dependency notes and constraints
This sheet is critical for complex agile environments where coordination determines success.
Dependency Matrix (Visual Impact Map)
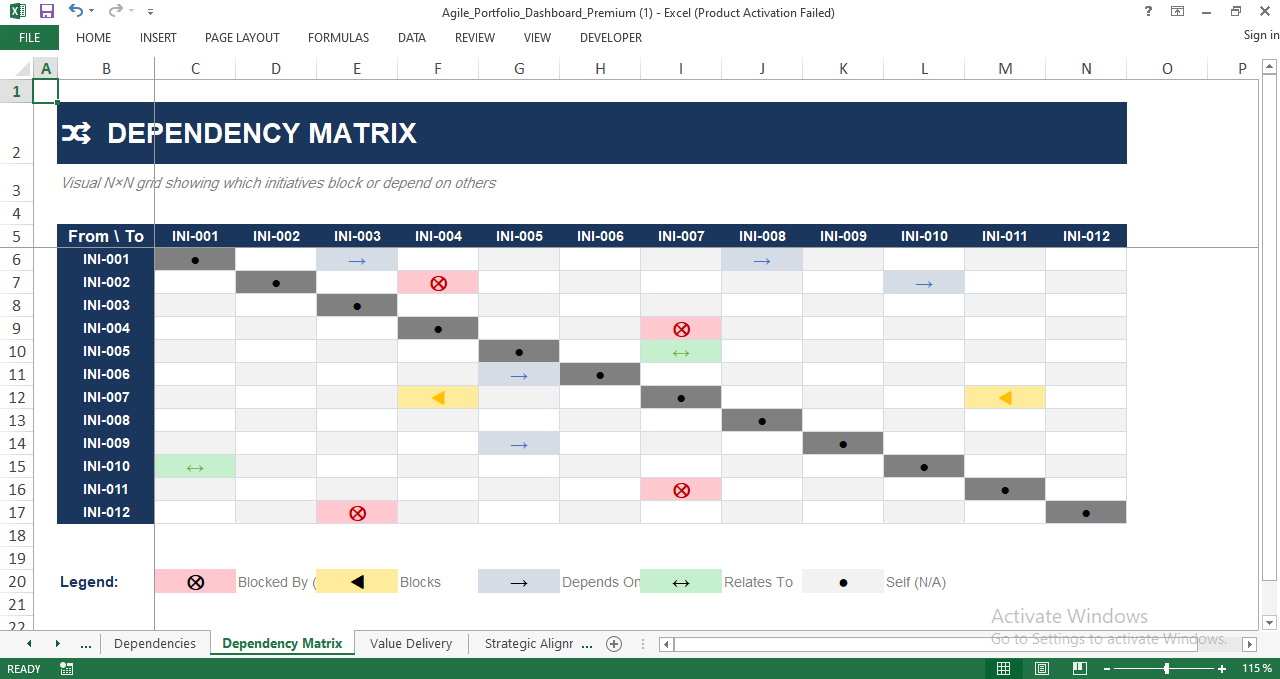
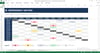
The Dependency Matrix transforms dependency data into a clear visual grid.
It shows:
- Which initiatives block others
- Which initiatives depend on others
- Self-contained work vs high-risk coupling
- Direction and type of dependency at a glance
This enables leadership to quickly identify bottlenecks and sequencing risks without reading long tables.
Release Calendar & Roadmap Planning
The Release Calendar sheet provides structured release planning across versions and timelines.
You can:
- Define releases, versions, and release types
- Track release status and ownership
- Link initiatives to releases
- Maintain deployment notes and scope clarity
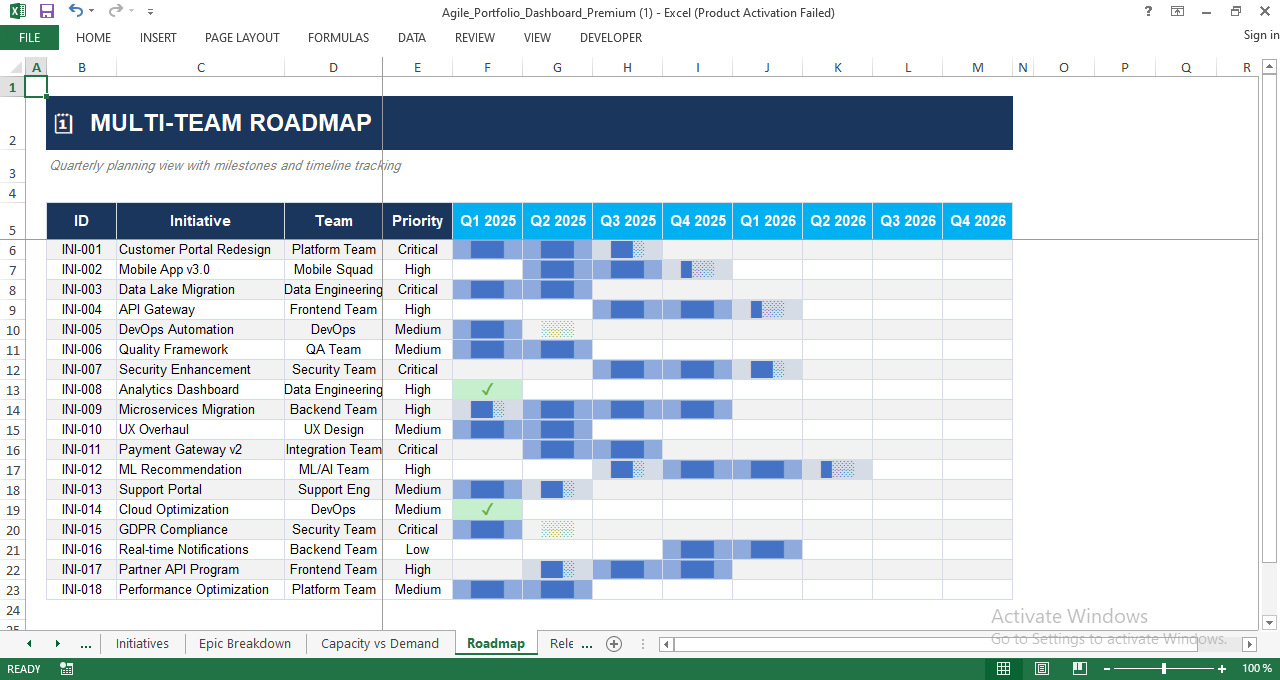
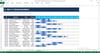
The Multi-Team Roadmap complements this with a quarter-by-quarter visual timeline, showing initiative flow across teams and years.
Together, they support realistic planning, stakeholder communication, and roadmap governance.
Value Delivery & ROI Tracking
The Value Delivery Tracking sheet connects execution to real business outcomes.
You can:
- Track estimated vs actual value
- Capture delivery costs
- Calculate ROI automatically
- Classify value type (Revenue, Cost Savings, Efficiency, Risk Mitigation, Compliance)
- Record measurable business outcomes
This ensures the portfolio is managed on value delivered, not just work completed.
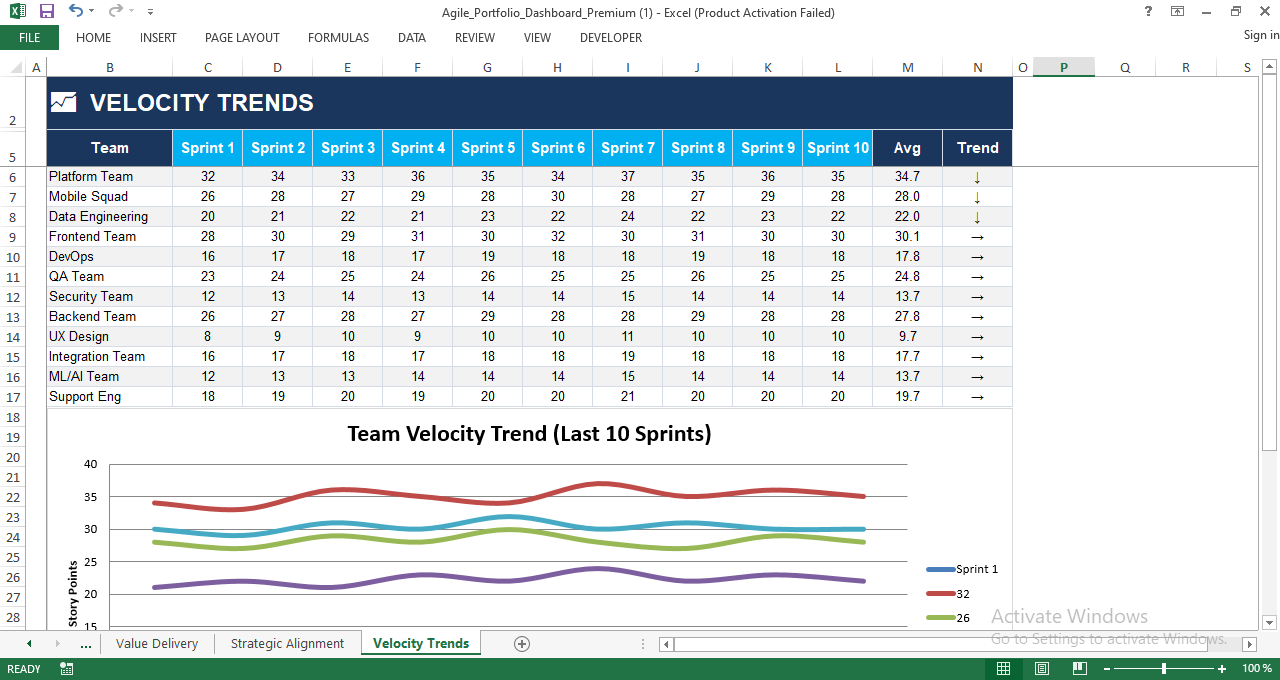
Velocity Trends & Performance Stability
The Velocity Trends sheet tracks team performance over multiple sprints.
It includes:
- Sprint-by-sprint velocity tracking
- Average velocity calculation
- Trend indicators (improving, stable, declining)
- Visual trend charts for fast analysis
This helps agile leaders separate temporary fluctuation from structural delivery issues.
Built for Professionals
This template is ideal for:
- PMOs and Portfolio Managers
- Agile Coaches and Transformation Leads
- Product & Engineering Leadership
- Enterprise Delivery Organizations
- Consultants managing multi-client portfolios
Key Advantages
- Fully automated Excel system (no macros required)
- Clean, executive-ready design
- Scales from small portfolios to enterprise programs
- Replaces multiple disconnected tools
- Designed for real-world agile complexity
- Perfect for governance, reviews, and decision-making